Rusi Yang (Consulting Manager)
Most companies have years of sales, operational, and financial data sitting in disconnected systems. Decisions on top of that data are still being made with manual spreadsheets, gut feel, and reports that took three people a week to build. Machine learning implementation is the structured process of turning that raw data into a working prediction system, covering 12 defined steps from problem definition through to deployment and continuous improvement. Organisations that complete all 12 steps correctly report invoice processing up to 90% faster, fraud detection accuracy above 90%, and cash flow forecasts accurate enough to cut late payments in half.
Machine learning runs quietly in the background of most industries today. In business specifically, it forecasts revenue, identifies risks, classifies emails, understands documents, allocates resources, prioritises sales pipelines, and automates processes that used to require hours of manual work. When implemented correctly, it becomes an invisible engine for better decisions.
Implementing ML is not an algorithmic exercise. It is a structured business journey. The objective is simple: bridge the gap between “we have data” and “we make smarter decisions every day.” First comes clarity on the business problem. Then comes the search for the right data, followed by exploration, cleaning, and transformation. Only then can models be trained, validated, deployed, and improved. The following story shows exactly how that journey looks in practice.
Alice had just joined GreenGrocer, a local organic supermarket chain that struggled every week with the same painful problem: shelves overflowing with spoiled berries, while avocados ran out by mid-week.
Everyone had theories. No one had answers. Alice decided this would be her first real project.
Before touching a line of code, she sat with store managers, cashiers, and buyers. She asked simple questions:
The answers painted a clear picture: GreenGrocer didn’t need ‘more data’ — they needed clarity. Their real problem wasn’t logistics. It was forecasting.
Alice next asked for all the historical sales information. What she received was… chaos. Spreadsheets from different years, formats, and file types; some came from POS systems, others from suppliers.
She gathered everything: daily sales, stock levels, weather logs, holiday calendars, discount history, pulling them all into one place.
The deeper she looked, the messier it got. Zeros that were actually missing values. Duplicate entries from system glitches. Strange outliers, like 400 avocados sold in one hour.
Alice cleaned patiently, row by row, fixing dates, removing duplicates, smoothing spikes, and filling gaps. The data finally felt trustworthy.
Now the fun part began.
Plots. Correlations. Seasonality curves. Weekly patterns.
That’s when she saw it:
Alice wasn’t just analysing numbers. She was discovering the hidden behaviour of customers.
She realized raw sales numbers weren’t enough. So she enriched the dataset:
Each new feature helped the model understand demand the way a human would.
Before choosing any model, Alice needed to make sure she wasn’t fooling herself. A model can look perfect if it is tested on the same data it learned from. The real challenge is whether it can predict what it has never seen.
So she divided the dataset carefully.
She trained the model on several years of historical data and reserved the most recent months as a “future simulation.” The model would never be allowed to see these final months during training.
This mirrored the real world: the model learns from the past and must forecast the future.
By splitting the data this way, Alice could see whether her system genuinely understood demand patterns or was simply memorising historical values. If it could accurately predict the unseen period: holidays, surprises, slow weeks, sudden spikes, then she knew it was ready for proper modelling.
With the split complete, she finally had a trustworthy setup: one part for learning, one part for testing, and a realistic way to judge if any model could stand up to real-life volatility.
Alice didn’t know which approach would work best. So she tried several:
Each had strengths; each had blind spots. She compared accuracy, looked at errors, and watched how they handled extreme cases.
She selected the model that performed the most consistently. Not just on good days, but on messy, unpredictable ones. Then she trained it properly:
The model began predicting demand with surprisingly sharp intuition.
Alice wasn’t satisfied with “high accuracy.” She tested the model on completely unseen weeks:
Hot weeks. Cold weeks. Holiday rushes. Slow seasons.
She measured how far predictions deviated, which products remained tricky, and whether the model could anticipate sudden spikes.
She improved it until it passed every stress test.
Now came the moment of truth. Alice integrated the model into the purchasing workflow.
A simple dashboard displayed recommended order quantities for each product every morning. Store managers didn’t need to understand machine learning. They just needed reliable numbers.
Marta, the senior buyer, tried it first.
“Only 32 boxes of avocados this week?” Alice nodded. “Trust it.”
Over the next weeks, Alice watched the predictions closely. When a heatwave hit unexpectedly, the model slightly underpredicted berry sales. She analysed the cause, added new features, retrained the model, and improved its resilience.
The system grew sharper with each observation.
Store managers gave feedback:
Alice incorporated these insights, making the model more aligned with real operations.
GreenGrocer’s waste dropped. Stockouts disappeared. Revenue rose. And the stores finally stopped having “Worry Meetings.”
What Alice built for a local supermarket, organisations across finance, operations, and compliance are building at scale. Industry data shows that companies implementing ML-based invoice processing correctly achieve straight-through processing rates above 88%. Those running ML on fraud detection report accuracy rates above 90%. And businesses using ML for cash flow forecasting have cut late payments in half while saving hundreds of thousands annually in unnecessary financing costs. The methodology behind those results is the same 12 steps Alice followed. The only difference is the size of the problem being solved.
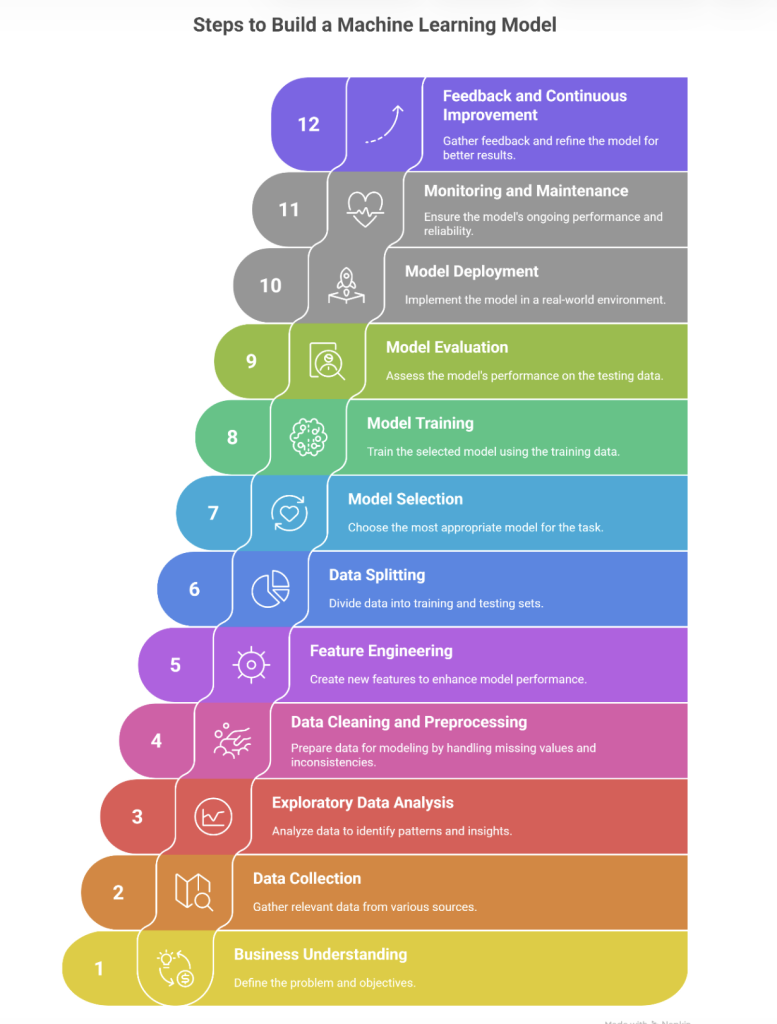
12 Steps to Build a Machine Learning Model]
At Kibo AI, every ML engagement begins with alignment. Starting with the wrong problem is the most expensive mistake any organisation can make. This first step resembles choosing a destination before starting a journey. Many teams want to jump straight into the data or model selection, but without a shared objective, they risk delivering something technically impressive that brings no business value.
Business leaders contribute context: financial pressure points, delays, inefficiencies, missed opportunities. Data teams contribute structure: the ability to convert broad frustrations into measurable objectives. Together, they define what success looks like and how it will be measured.
Forecasting is a clear example. In many companies, regional teams submit Excel files filled with assumptions and last-minute adjustments. Finance spends weeks merging versions, correcting errors, and negotiating inconsistencies. When executives ask why forecasts fluctuate, the explanations are uncomfortable and unclear.
Kibo AI facilitates a structured conversation between Finance and data teams to define the real challenge: forecasts are slow, inconsistent, and unreliable. The objective becomes precise: “Predict monthly revenue for each region within ±5% using historical sales and key business drivers.” With this clarity, the entire ML initiative gains direction and purpose.
Once the objective is clear, Kibo AI gathers the raw ingredients. ML cannot deliver results if critical data is missing, unreliable, or segmented across silos. This step is investigative: identifying where data lives, who owns it, what format it is stored in, and how complete it is.
In real-world revenue forecasting programs, Kibo AI often sees data scattered across CRM systems, financial tools, marketing platforms, and external economic sources. The goal is to connect everything into a unified dataset.
As the unified dataset comes together, common problems surface: missing months from certain regions, mismatched currency conversions, inconsistent campaign data. With patience and structure, Kibo AI consolidates all of this into a single source of truth that updates automatically. For many organisations, this is the first time all regions finally look at the same numbers.
This is where the data begins to speak. Kibo AI visualises trends, seasonality, spikes, dips, and correlations, turning raw data into shared understanding.
Clear seasonal patterns appear. December shows strong revenue surges. Summer dips become evident. Marketing spend reveals a two-month lag before results appear. Regional anomalies prompt discussions: Finance reveals that a sudden drop wasn’t a demand issue but a supply chain disruption.
EDA turns charts into understanding. By the end of this phase, everyone sees the business through the lens of the data. A foundation that ensures the model reflects real behaviour rather than assumptions.
Raw data is never clean. If left untreated, inconsistencies will damage the model’s accuracy. This stage is where disorder becomes structure.
As the dataset comes together, Kibo AI uncovers predictable issues: gaps in reporting, inconsistent formats, outdated conversions, one-time promotions that distort trends. Each problem is resolved systematically until the dataset becomes trustworthy and aligned.
Once the cleaning is complete, the dataset finally reflects how the business actually behaved: consistent, complete, and ready for modelling.
This is where raw data turns into intelligence. Kibo AI collaborates closely with Finance to identify what truly drives revenue. Instead of feeding the model raw inputs, the team designs features that mirror how an experienced analyst thinks.
Rolling averages capture trend momentum. Ratios reflect marketing effectiveness. Calendar flags highlight seasonal peaks. Inflation adjustments distinguish real demand from price-driven increases.
Each new feature gives the model a richer, more human-like understanding of the business. This stage is often the difference between a mediocre model and one that truly delivers value.
Before training the model, the data must be divided carefully. Kibo AI ensures that training and testing reflect real-world conditions. The model trains on historical data and must predict the most recent quarter: information it has never seen.
If it can accurately forecast Q4 using only data available before Q4 began, confidence in the model grows. This realistic evaluation prevents the system from memorising history instead of learning genuine patterns.
Model selection is about choosing the right tool for the problem. Kibo AI evaluates several models, considering accuracy, interpretability, scalability, and how easily results can be explained to leadership.
ARIMA understands seasonality but misses marketing effects. XGBoost captures complex interactions but needs explainability tools for stakeholder trust. A hybrid approach often combines the strengths of both.
With SHAP, Kibo AI shows Finance exactly which factors drive predictions: marketing spend, inflation, trend changes, building transparency and credibility. The chosen model becomes the core of the forecasting solution.
The model now begins to learn. It adjusts itself as it observes patterns across years of data. Kibo AI monitors each iteration, ensuring the system learns genuinely useful relationships instead of memorising noise.
The model gradually stabilises, showing consistent performance across unseen validation data. Finance reviews early predictions and begins to understand the model’s logic, building trust ahead of formal evaluation.
Evaluation is the truth test. After training, the model forecasts the most recent quarter using data it has never encountered. Kibo AI analyses where predictions deviate and works through the reasoning with business stakeholders. In financial operations, this is where the gap between manual forecasting and ML becomes concrete.
Manual cash flow forecasts built on fragmented spreadsheet data typically miss liquidity risks by weeks. ML-based models that are properly trained and evaluated have demonstrated accuracy rates of 90-95% in comparable programmes. FP&A confirms whether the model reflects business reality. Once it hits the accuracy target, deployment begins.
Deployment is where the model becomes a real business tool. Kibo AI packages the forecasting system as a secure cloud service. New data triggers automatic predictions that flow into dashboards and reports without manual intervention.
Controllers open their usual Power BI workspace and see updated forecasts instantly: no spreadsheets, no versioning issues, no delays. The forecasting process becomes faster, more consistent, and always up to date.
Business conditions evolve, and models must evolve with them. Kibo AI monitors the model’s performance continuously. If accuracy drifts, the system alerts the team.
In one region, forecasts begin deviating because a new product launched: something the model couldn’t have learned earlier. Kibo AI retrains the model with updated information, restoring performance immediately.
Monitoring ensures the system stays aligned with reality.
The final stage turns ML into a living asset. Each month, users provide context: delayed campaigns, regulatory changes, unexpected disruptions. Kibo AI feeds this knowledge back into the model during retraining cycles.
Over time, forecasts become stronger, more stable, and more aligned with actual business behaviour. The model grows with the organisation, not away from it.
The companies that structure their ML implementation correctly are already seeing where the gains come from. Finance teams processing invoices in hours instead of days. Compliance teams catching duplicate payments and fraud patterns that rule-based systems miss entirely. Treasury functions forecasting cash positions with enough accuracy to cut unnecessary financing costs.
None of this requires a data science department or a multi-year transformation programme. It requires a clear problem, the right data, and a structured path from raw information to a working prediction system. That is what the 12 steps in this article describe. And it is what Kibo AI delivers.
Ready to implement machine learning in your organisation? Let’s talk
A typical ML implementation from business understanding to first deployment takes between 8 and 16 weeks, depending on data availability, complexity, and organisational readiness. Monitoring and improvement continue after deployment.
Most organisations already have enough data to begin. What matters more than volume is relevance and quality. Historical sales records, CRM data, financial results, and operational logs are common starting points. A structured data audit is usually the first step.
Traditional analytics describes what happened in the past. Machine learning goes further. It identifies patterns in historical data and uses them to forecast future outcomes or automate decisions. ML adapts as new data comes in, while traditional analytics requires manual updates.
Not necessarily. With the right external partner and a well-defined business problem, even mid-sized organisations can implement and benefit from ML. The key is having a structured methodology and close collaboration between business and data teams throughout the process.
Success is measured against the business objective defined at the start. For example: forecasting revenue within ±5% accuracy, reducing stockouts by 30%, or cutting manual reporting time in half. Technical metrics like RMSE or MAPE support these business KPIs but are not sufficient on their own.
Machine learning delivers value across industries wherever there is historical data and a need for better predictions or decisions. Common use cases include revenue forecasting in Finance, demand planning in Retail and Supply Chain, churn prediction in SaaS, risk scoring in Financial Services, and resource allocation in Operations.

Rusi leads AI strategy and digital transformation initiatives across finance, automotive, manufacturing, consumer goods, pharmaceuticals, and entertainment.
Rusi has shaped enterprise roadmaps and guided cross-functional teams in delivering automation, data science, and AI programs that generate measurable business value.
With 6+ years of international experience, he partners with executives to align technology with business objectives and drive sustainable, innovation-led change.
